The global stockout bill is $1.2 trillion per year. That is a real number from a real study, and it is completely useless to you. Nobody running a Shopify store looks at a trillion-dollar figure and thinks “I need to fix this.” It is too big. Too abstract. Too far from your dashboard.
This article does the math that nobody else has done: scaling the stockout cost down to what a Shopify store doing $250K, $500K, or $1M per year is actually losing. Not in theory. In dollars you can trace through your own analytics. The cost breaks down into three layers, and the first one (direct lost sales) is only the beginning.
Where does the $1.2 trillion stockout number come from?
IHL Group’s 2023 study on inventory distortion found that retailers worldwide lose $1.77 trillion per year to inventory problems. Of that total, out-of-stocks account for $1.2 trillion and overstocks account for $562 billion (IHL Group’s 2023 inventory distortion research, 2023).
In North America specifically, stockouts cost retailers $144.9 billion annually (Opensend’s inventory stockout rate data, 2024).
Two details make these numbers relevant to small and mid-size Shopify stores. First, the largest single driver is supplier timing issues, not forecasting failures. Most out-of-stock events happen because a reorder was placed too late, not because demand was unpredictable. Second, ecommerce stores are not immune to the problem simply because they do not have physical shelves. A product page that says “sold out” is the digital equivalent of an empty shelf, and it has the same consequences. Understanding back-in-stock demand data for inventory planning is the first step to reducing that timing gap.
What does a stockout actually cost a store doing $500K a year?
The average ecommerce out-of-stock rate is 8% of SKUs at any given time (Opensend, 2024). For promotional or high-demand items, that rate spikes to 10%. And 53% of Shopify products experience at least one stockout period per year, with the average stockout lasting 35 days (Orlio’s stockout cost analysis, 2024).
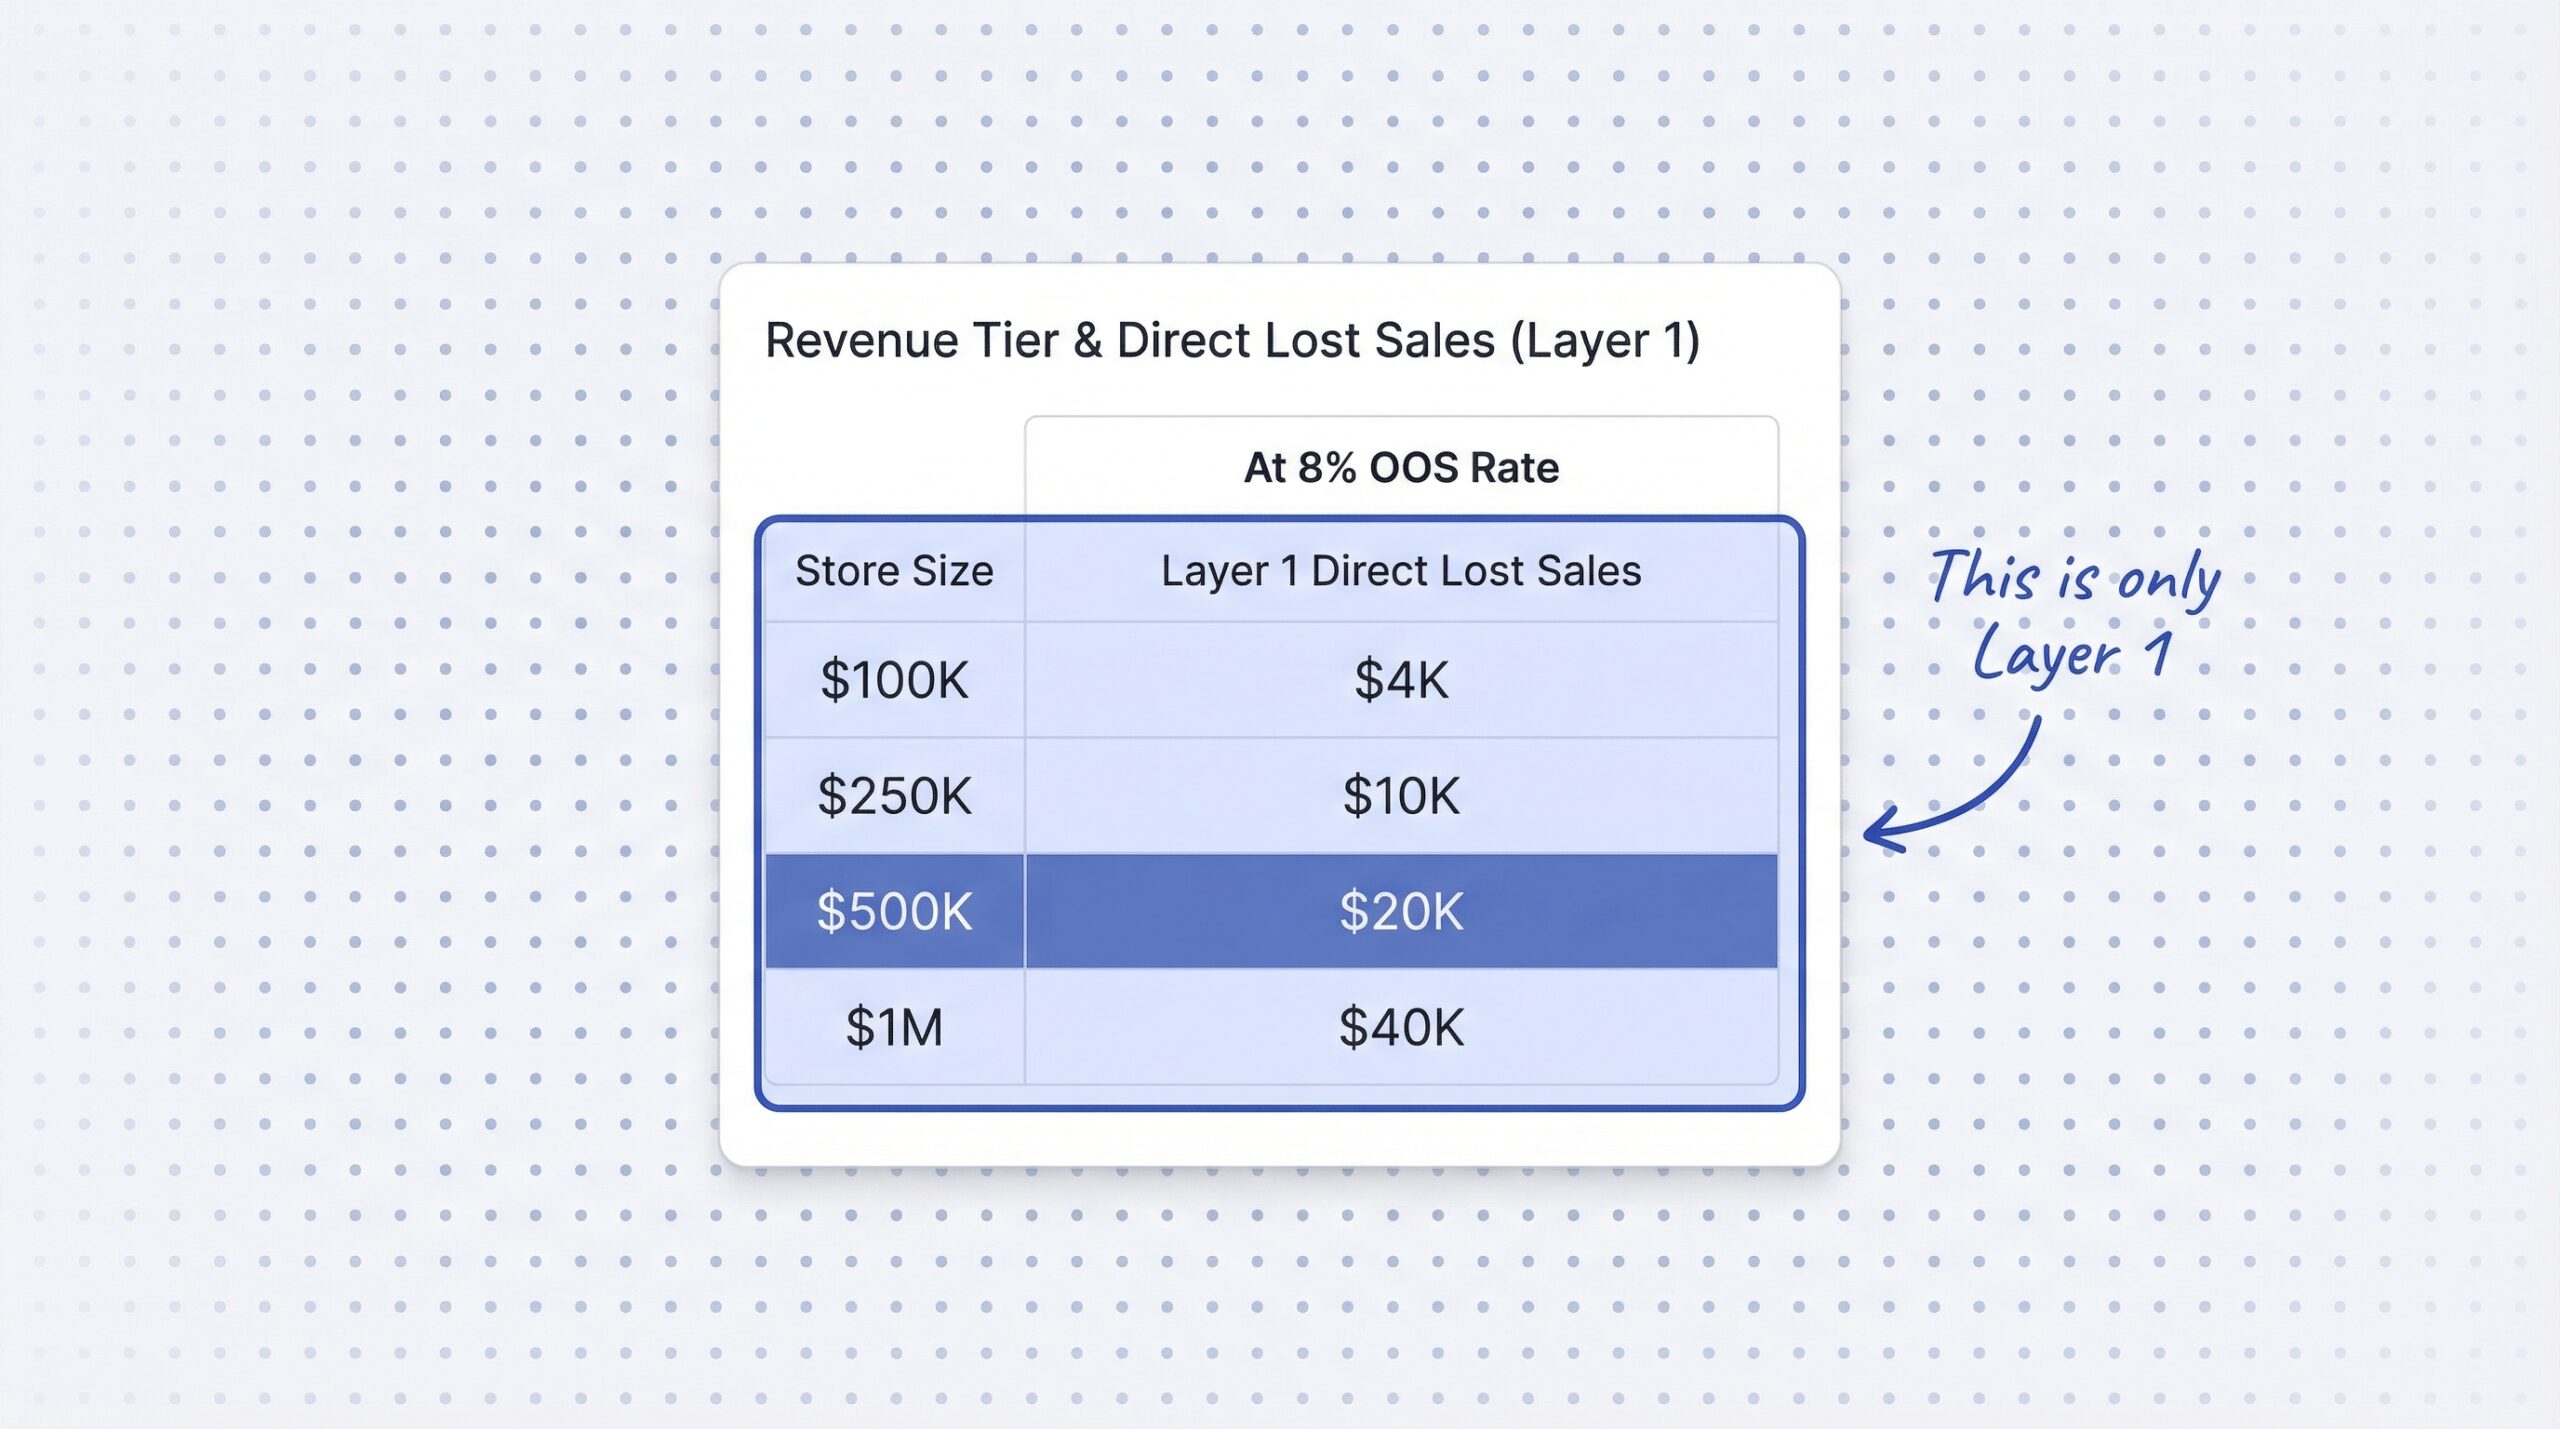
At an 8% OOS rate, ecommerce stores lose approximately 4% of annual revenue in direct missed sales. That is Layer 1: the orders that could not be placed because the product was not available.
Here is what Layer 1 looks like at different store sizes:
| Store Annual Revenue | Layer 1: Direct Lost Sales (at 8% OOS rate) |
|---|---|
| $100,000/year | $4,000/year |
| $250,000/year | $10,000/year |
| $500,000/year | $20,000/year |
| $1,000,000/year | $40,000/year |
Those are conservative numbers. They assume an average OOS rate and average stockout duration. If your store has a few high-demand SKUs that go out of stock frequently, your actual number is likely higher. And Layer 1 is only the cost you can see.
What are the hidden costs beyond direct lost sales?
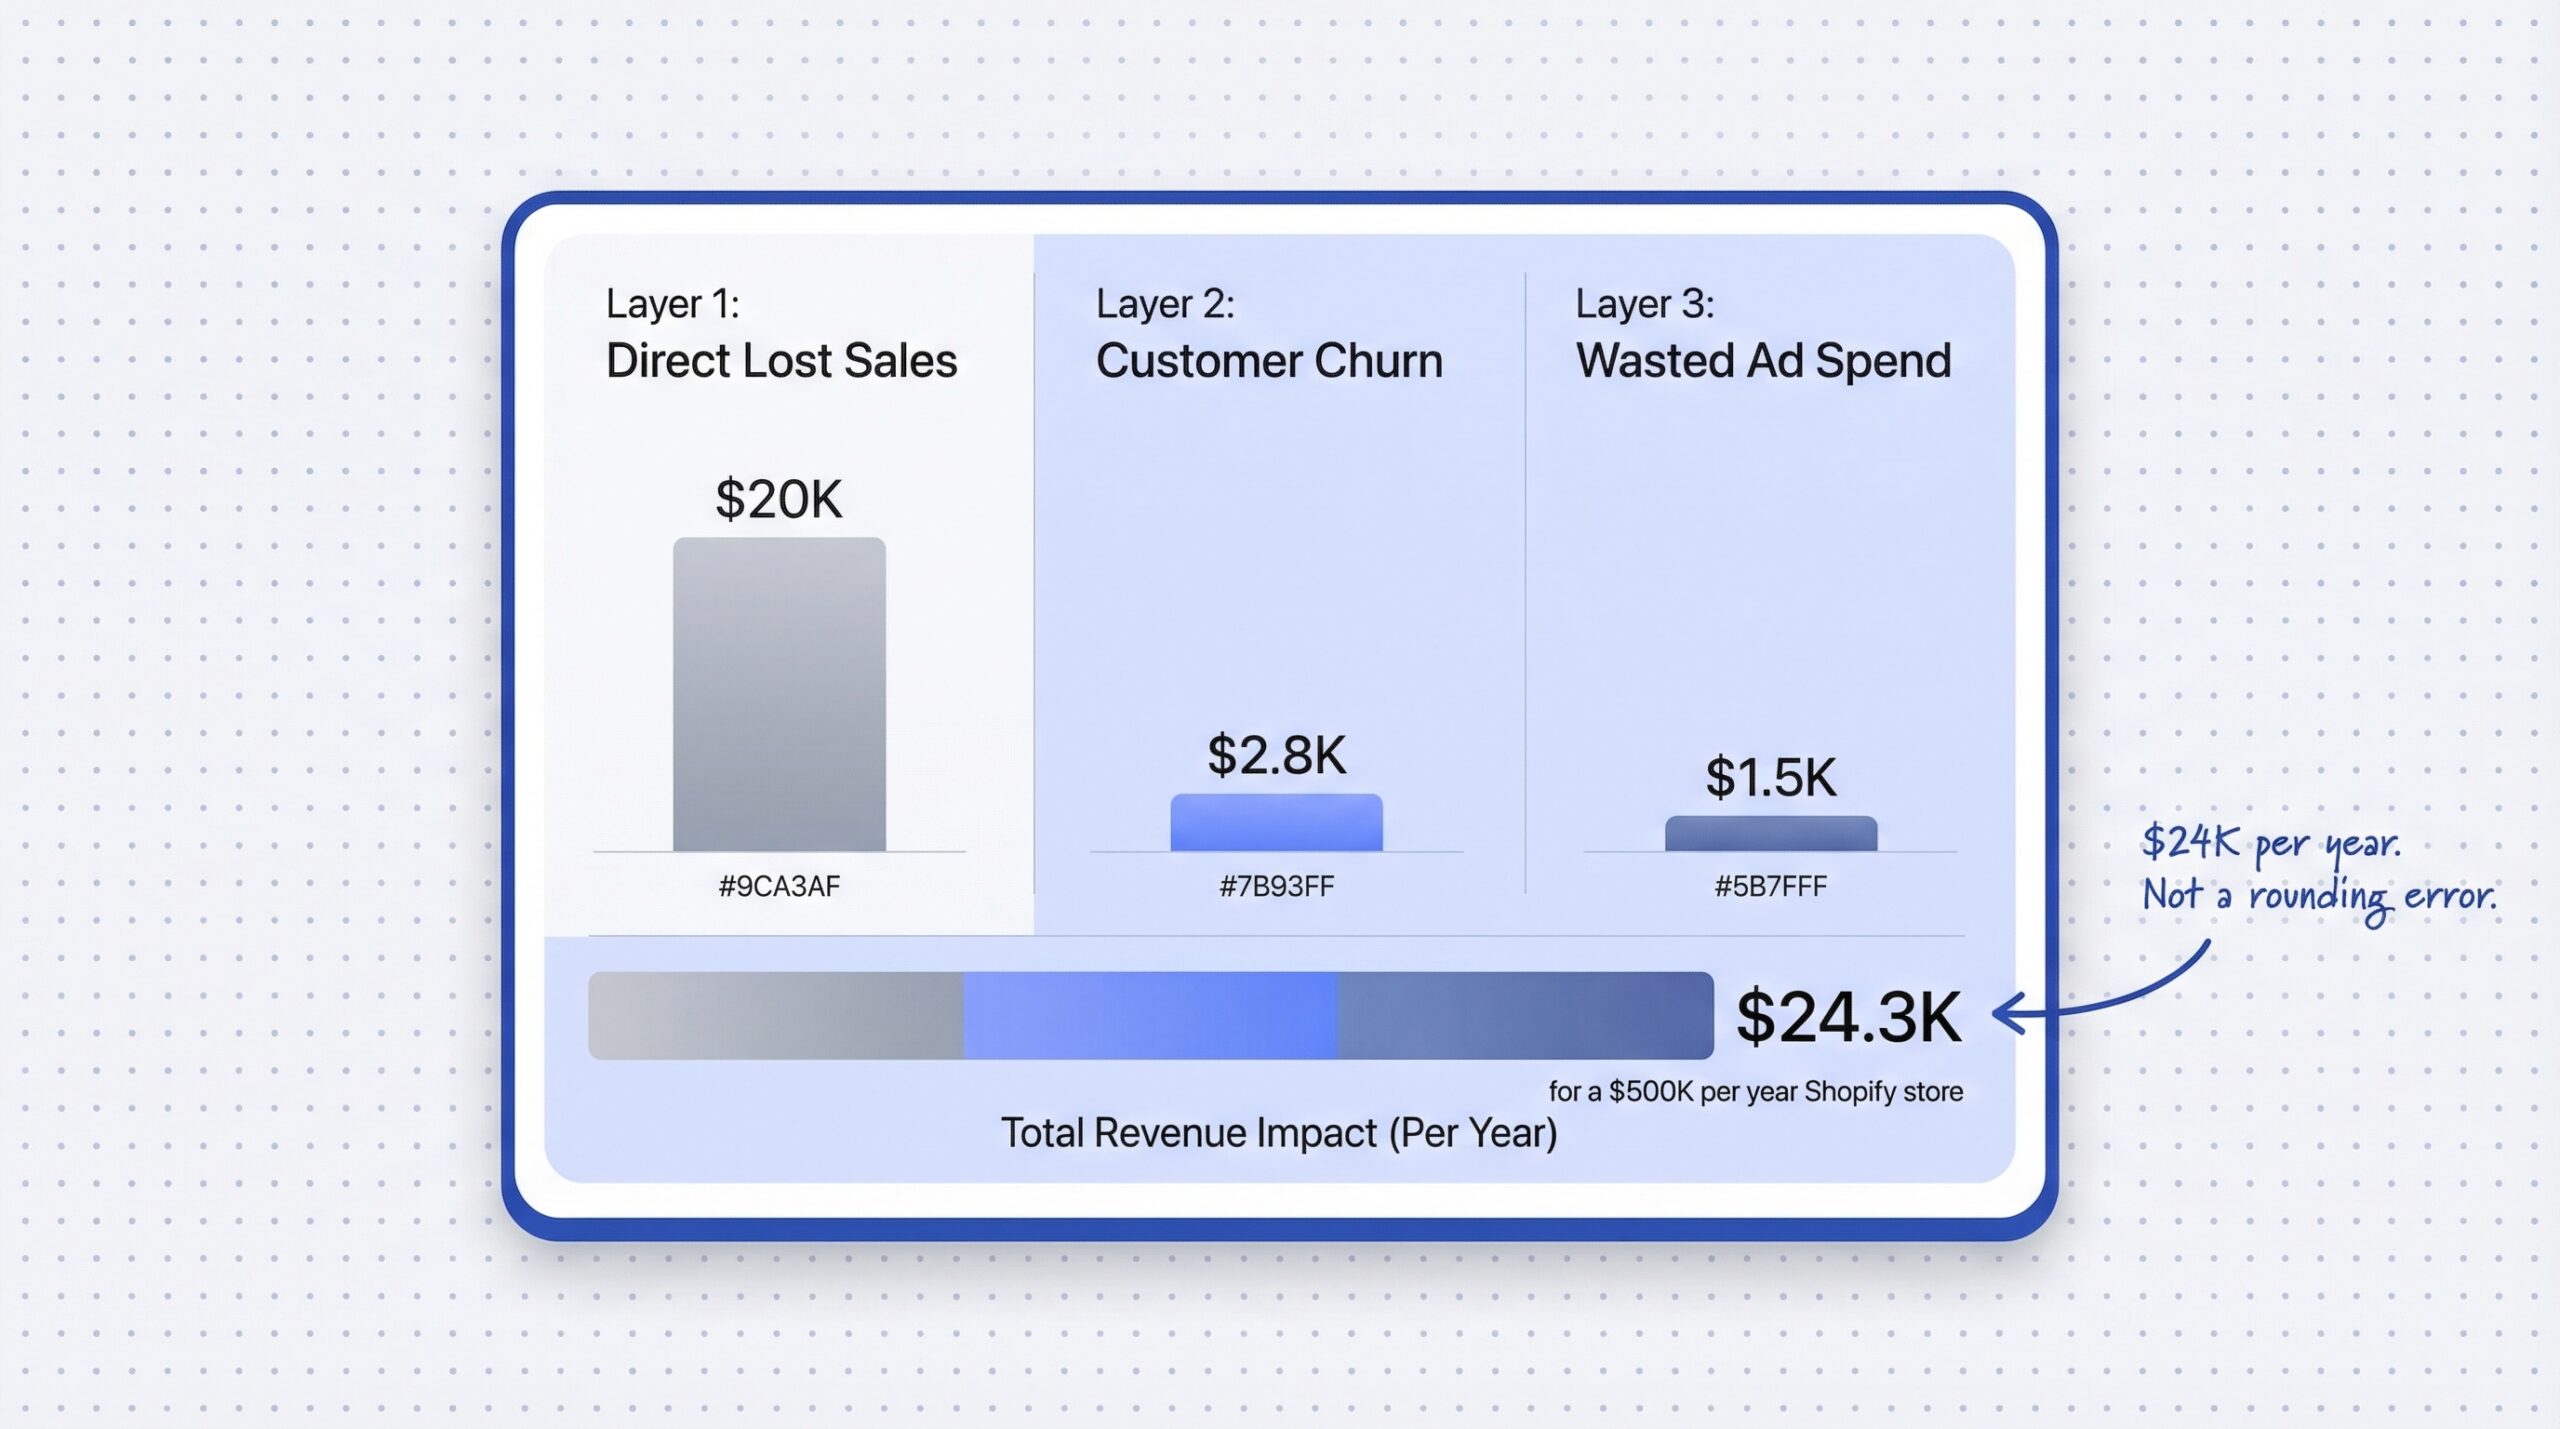
Layer 1 measures missing orders. Layer 2 and Layer 3 measure the damage that compounds after the customer leaves.
Layer 2: Customer churn. When shoppers hit an out-of-stock product page, 69% go to a competitor immediately. That is not a slow fade. It is an instant redirect of purchase intent to someone else’s store. Worse, 9% of customers permanently switch retailers after even a single out-of-stock encounter, and 43% permanently switch brands after the experience.
For a $500K store processing roughly 2,000 orders per year: if 8% of products are out of stock at any time and about 160 customers encounter an OOS page, a 9% permanent churn rate means roughly 14 customers lost forever. At an average customer lifetime value of $200, that is $2,800 per year in pure brand damage, concentrated on your best-selling products where stockouts hurt the most.
A deeper look at what stockouts actually cost your Shopify store breaks down these compounding effects by SKU type.
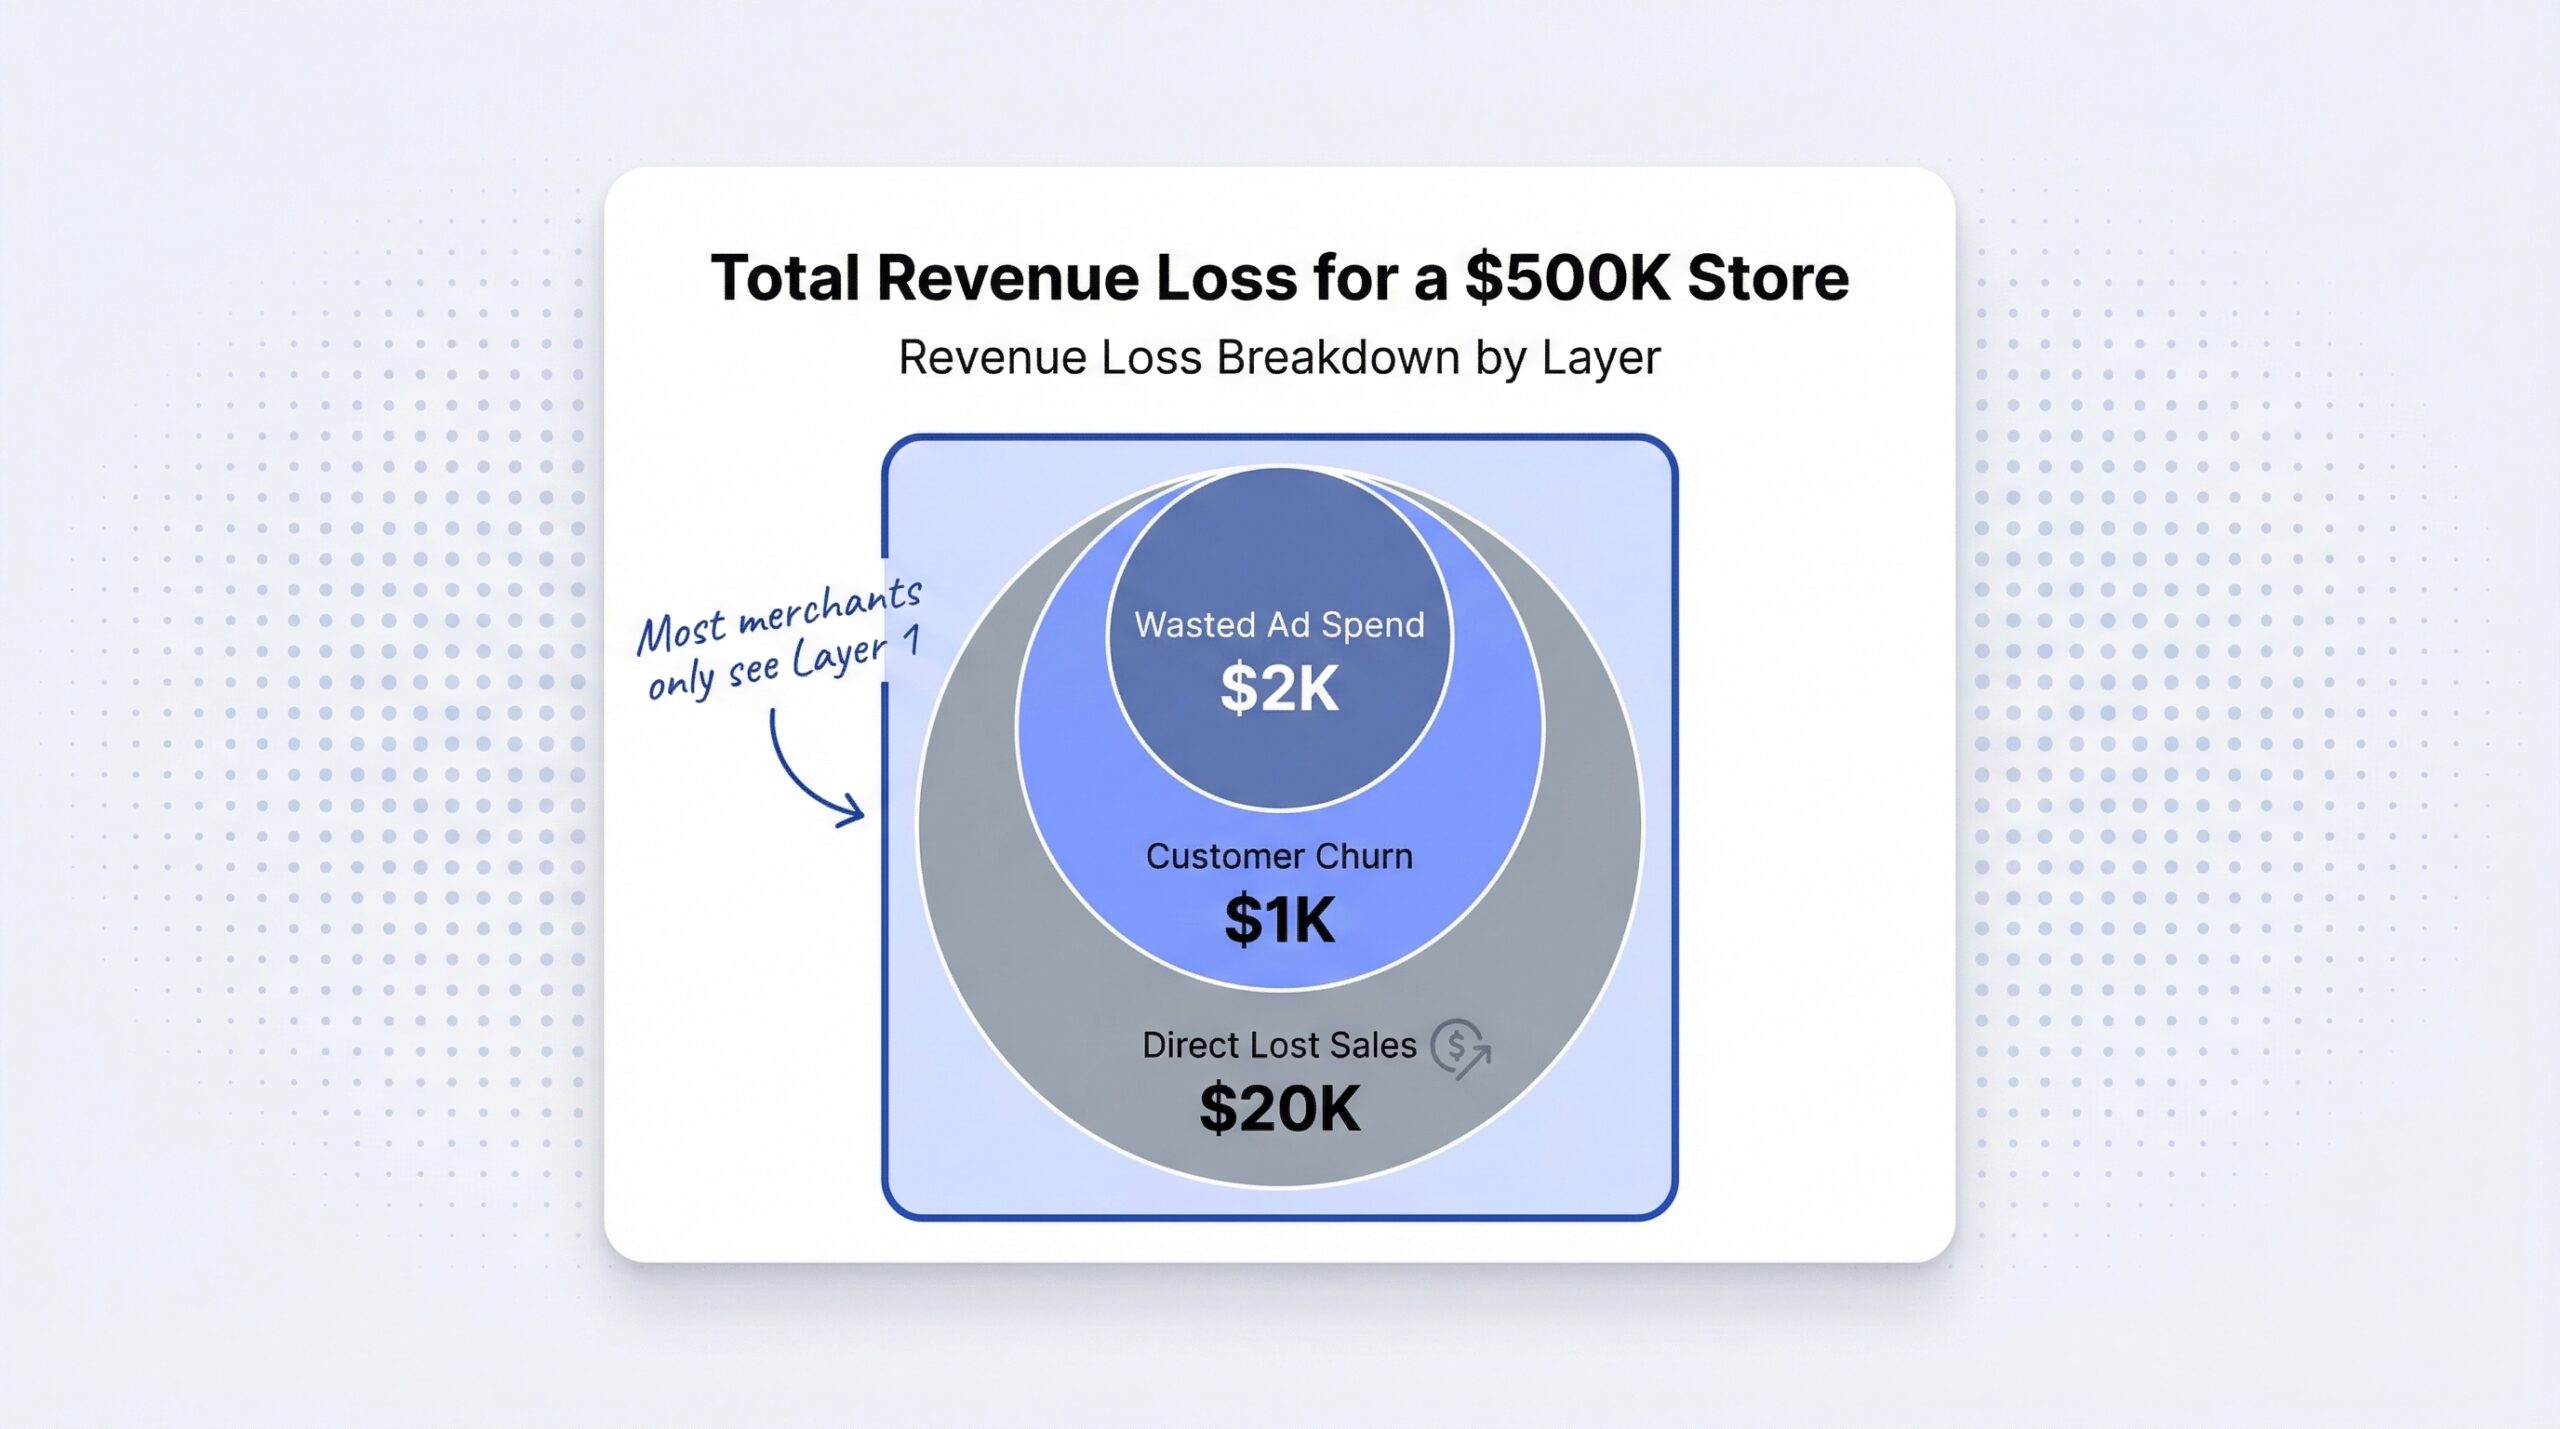
Layer 3: Wasted ad spend. Every time a customer clicks a paid Meta or Google Shopping ad and lands on a sold-out product page, you have paid for a visit with zero chance of conversion. At an average Shopify CPC of $0.85-$1.50, a product that is out of stock for 35 days and receives 50 clicks per day burns $1,487 to $2,625 in ad spend with no revenue return.
Combined cost for a $500K store (conservative): $20,000 (Layer 1) + $2,800 (Layer 2) + $1,500 (Layer 3) = roughly $24,300 per year. That is not a rounding error. That is a part-time employee, a major ad campaign, or an inventory buffer that prevents the problem entirely.
Can back-in-stock notifications actually recover the loss?
Not all of that $24,300 is permanently lost. The portion that depends on timing, which is most of Layer 1, can be partially recovered if you capture the customer’s intent at the moment they encounter the stockout.
91% of shoppers say they want to be notified when a preferred item returns to stock (Lucidworks, 2023). And back-in-stock emails achieve a 58% open rate compared to the 26.6% ecommerce average (Omnisend’s 2024 ecommerce email benchmarks, 2024). The conversion rate is equally striking: back-in-stock emails convert at 22.45%, making them one of the highest-converting automated email types in ecommerce (MarketingSherpa back-in-stock case study data, 2023).
The recovery math for a $500K store: if 30% of customers who hit an OOS page sign up for notifications, and 22% of those convert when the restock email arrives, that is roughly $1,320 recovered per restock cycle. Over a year with multiple SKU restocks, the recovery adds up to several thousand dollars from a single automation.
The catch is that recovery only works if you capture intent at the exact moment the customer is on the product page. A notify me button on your Shopify product pages is the capture mechanism. Without it, the 69% who leave for a competitor are gone permanently. With it, a meaningful percentage come back.
For the full math on what that recovery looks like, see back-in-stock alerts ROI on Shopify.
How to calculate your own stockout cost in 10 minutes
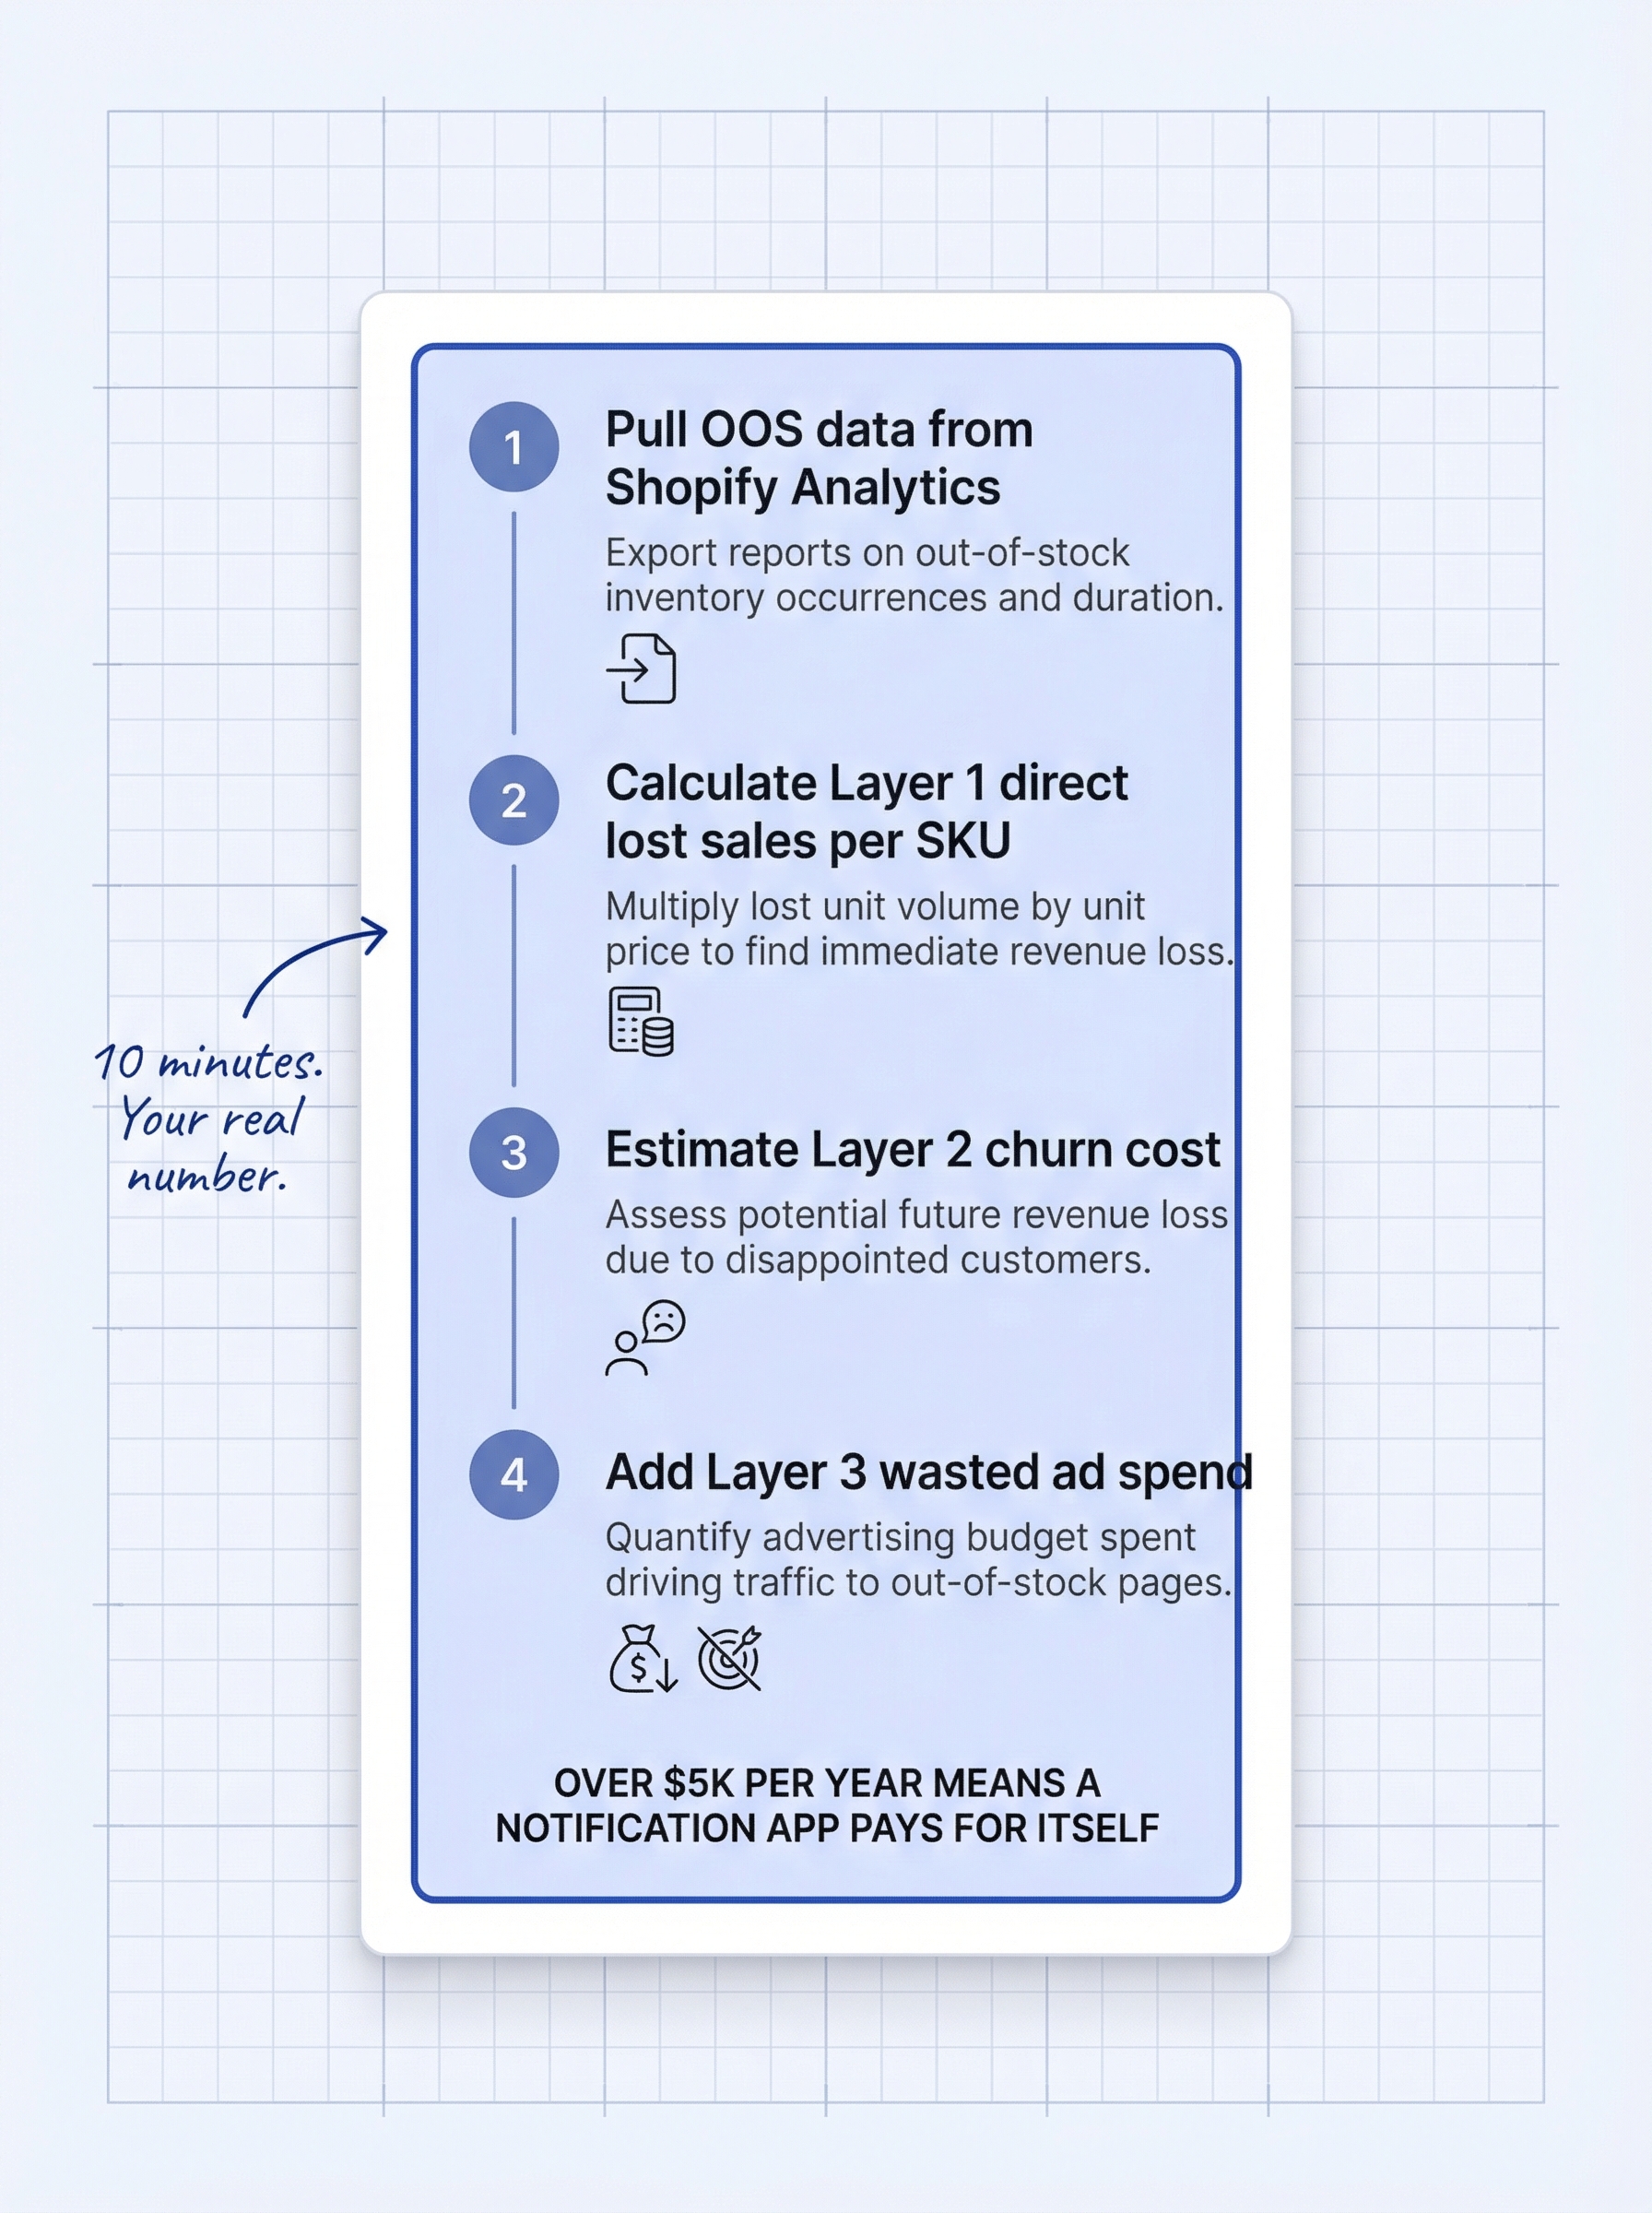
You do not need the industry-wide numbers. You need your numbers. Here is how to calculate your store’s actual stockout cost in four steps.
Step 1: Pull your OOS data. Open Shopify Admin and go to Analytics > Reports > Inventory. Filter by products that went out of stock in the last 90 days. Note the SKU, the number of days it was out of stock, and its average daily revenue before the stockout.
Step 2: Calculate Layer 1 for each SKU. For each product that went OOS: (Daily revenue for that SKU) x (Days out of stock) = direct lost sales. Sum across all affected SKUs. This is your Layer 1 total.
Step 3: Estimate Layer 2. Pull unique visitor counts for each OOS product page during the stockout window (Google Analytics or Shopify traffic reports). Multiply by 9% (permanent churn rate) and then by your average customer lifetime value. This gives you the churn cost.
Step 4: Add Layer 3. Check your Meta and Google Ads dashboards for any campaigns pointing to OOS product URLs. Total the spend during the out-of-stock window. That entire amount was wasted.
Quick benchmark: If your total stockout cost exceeds $5,000 per year across all three layers, a back-in-stock notification app pays for itself within the first recovered restock cycle. And if the total surprises you, using signup velocity for predictive restocking can prevent many of those stockouts from happening in the first place.
Frequently asked questions about stockout costs
How much do stockouts cost Shopify stores per year?
At the industry average out-of-stock rate of 8%, ecommerce stores lose approximately 4% of annual revenue in direct missed sales. For a store doing $500,000 per year, that is roughly $20,000 in lost sales before factoring in customer churn or wasted ad spend.
What percentage of ecommerce products are out of stock at any given time?
The average ecommerce out-of-stock rate is 8% of SKUs at any point in time, according to Opensend’s 2024 analysis. For promotional or high-demand items, that rate spikes to 10%.
How many customers leave permanently after hitting a stockout?
Research from Opensend shows that 9% of customers permanently switch retailers after encountering even a single out-of-stock experience. A separate McKinsey study found that 71% of consumers switched brands or retailers when a desired product was unavailable.
What is the IHL Group $1.2 trillion stockout figure?
IHL Group’s 2023 study found that global inventory distortion costs retailers $1.77 trillion per year. Of that total, out-of-stocks account for $1.2 trillion and overstocks account for $562 billion.
Do back-in-stock notifications actually recover lost revenue?
Back-in-stock emails achieve a 22.45% conversion rate according to MarketingSherpa, making them one of the highest-converting automated email types in ecommerce. Recovery depends on capturing shopper intent at the moment they land on the out-of-stock product page.
How long does the average stockout last on Shopify?
According to Orlio’s 2024 research, the average stockout on a Shopify store lasts 35 days. During that window, 53% of Shopify products experience at least one stockout event per year.
Does running out of stock waste paid advertising spend?
Yes. Every click on a paid ad that lands on an out-of-stock product page costs money with no conversion possible. At average Shopify CPCs of $0.85 to $1.50, a product out of stock for 35 days receiving 50 daily clicks wastes $1,487 to $2,625 in ad spend.
What is the total stockout cost for a mid-size Shopify store?
For a store generating $500,000 per year, the combined stockout cost across three layers (direct lost sales, customer churn, and wasted ad spend) is conservatively estimated at $22,000 to $24,000 per year. The direct sales loss alone accounts for $20,000, with churn and wasted ads adding the remainder.